ClickHouse
hare-orm against SQLAlchemy and Django on ClickHouse: 12 scenarios on a table of 1,000,000 events, sorted by their key, and a concurrent load test. A shorter bar is faster, except in the load test, which counts operations per second.
Summary
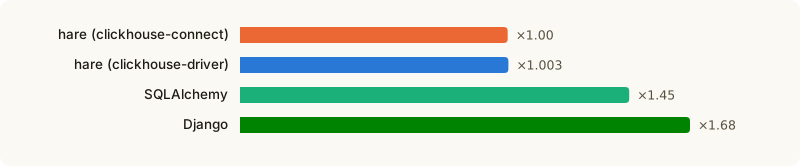
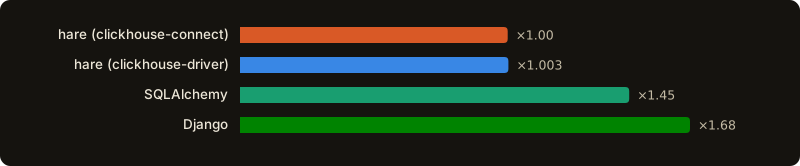
How many times slower than hare-orm on clickhouse-connect over HTTP (its faster driver in this run) each library is, on average: the ratio of geometric means of the times over every scenario both run, except the cold start.
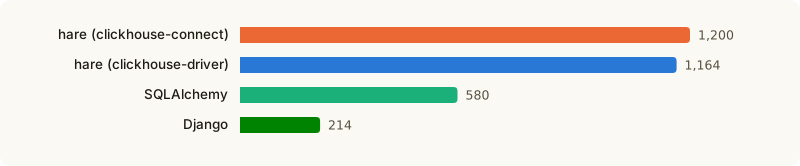
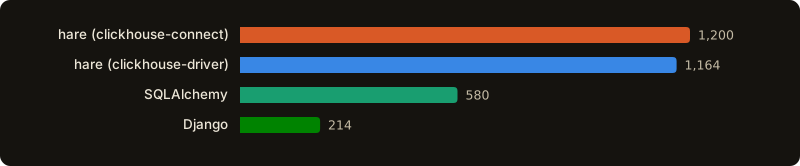
The load test: 50 workers run 1,000 operations: 80% get() by key, 20% a GROUP BY of a day.
Measured warm: every pool connection runs every operation of the load before the timing starts, as
in an application that has been running.
Operations per second:
By scenario
Each scenario is drawn on its own scale: compare the bars within one scenario, not across scenarios. The fastest time is in bold. A bar is the median of 5 runs, and the thin line over it spans the best run to the worst.
Reads
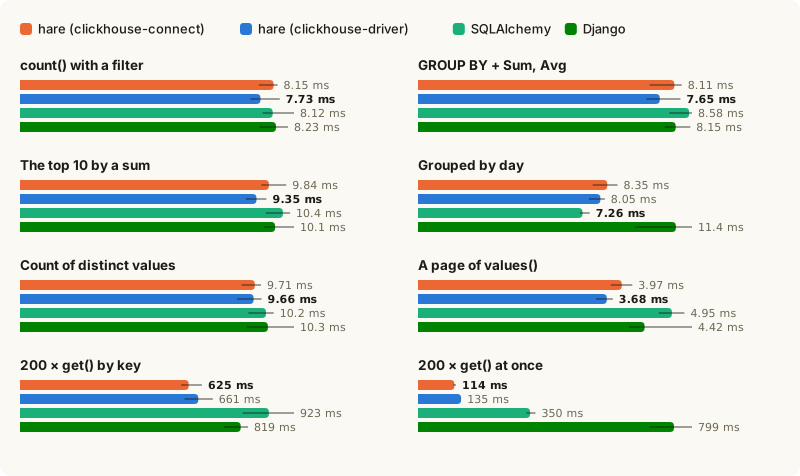
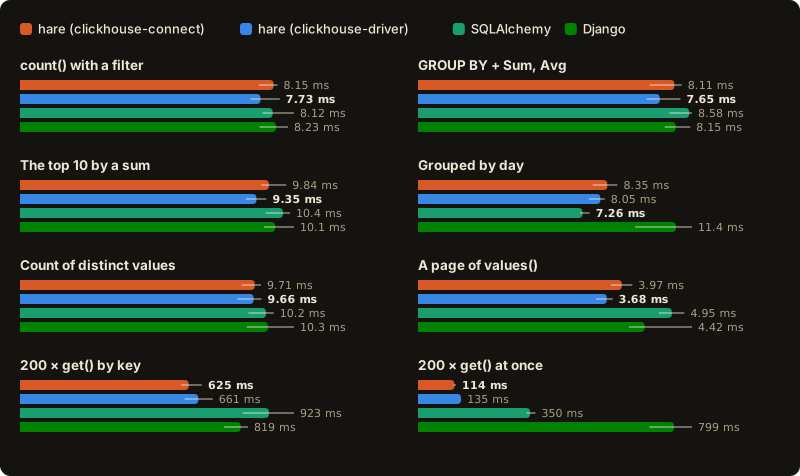
Writes and start
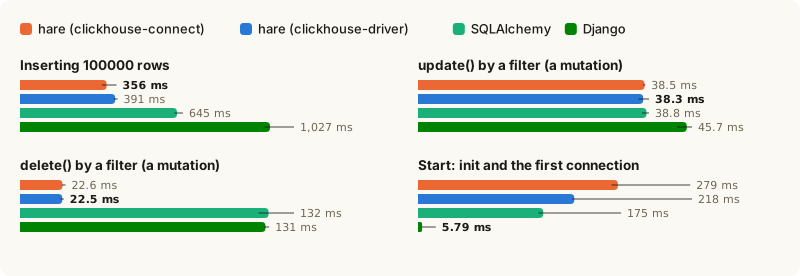
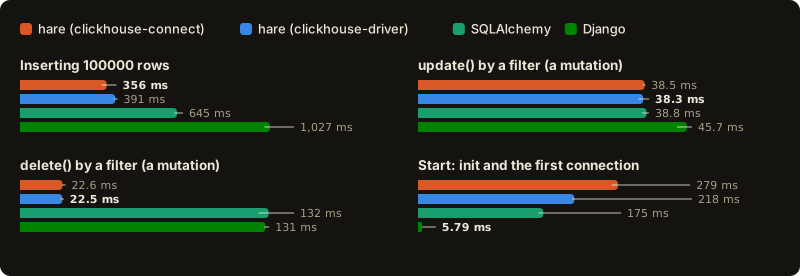
Where and how it was measured
| Date | 2026-10-30 |
| Machine | Windows 11, 13th Gen Intel(R) Core(TM) i5-13400, 16 CPU |
| Python | 3.14.3 |
| hare-orm release | 0.12.0 |
| Runs | 5, median |
| ClickHouse | 25.8.33.6 |
| asynch | 0.2.5 |
| clickhouse-connect | 1.10.0 |
| clickhouse-driver | 0.2.11 |
| hare-orm | 0.12.0 |
| clickhouse-sqlalchemy | 0.3.2, Python 3.12.3 |
| django-clickhouse-backend | 2.0 |
| Rows in the table | 1,000,000 |
- On PostgreSQL every ORM gets a pool of 50 connections, all opened before anything is timed.
- On PostgreSQL every table gets a
VACUUM (FULL, ANALYZE), untimed, before each group of scenarios and each load test, and autovacuum is off for them: every group starts from compact tables. Otherwise autovacuum clears the dead rows the writes leave at a random moment of the run, and whether it has come by decides the query plan — with a parallel scan or without. - Before a load test, every connection of the pool runs every operation of the load, untimed: the test measures an application that has been running, not one just started — each connection is open and has prepared its statements.
- Within a run, a scenario is repeated 3–5 times and its fastest repetition counts; the rows a write
scenario puts back are cleared before each repetition, untimed. The deletes and the many-to-many
add()change the data for good and run once. - Each ORM runs in a process of its own. The runs go round after round, the ORMs in a shuffled order each round; a scenario's result is the median over the runs.
- On Windows a run's process turns off its power throttling (EcoQoS): the scheduler otherwise may move a process without a window onto a hybrid processor's efficiency cores, where it runs at half the speed.
- SQLAlchemy runs twice on PostgreSQL and SQLite: with a transaction around each session (its default) and with the engine in autocommit mode, where every statement commits on its own, as in hare and Django.
- A scenario an ORM has no way to write is marked “not in this ORM” on its chart and left out of its average.
- The start is the library's init and its first query, timed with the library already imported; it is left out of the average.
- On SQLite every ORM runs on one file the way it does by default; SQLAlchemy's connections wait up
to 30 s for the file's write lock instead of the default 5 s — its pool of five otherwise stops
the write load at “database is locked”.
select_for_update()isn't measured on SQLite, which has no row locks. - The server fills the ClickHouse table before the scenarios; a mutation (
update(),delete()) finishes before its call returns in every library. SQLAlchemy runs through clickhouse-sqlalchemy 0.3.2 with the asynch 0.2.5 driver on SQLAlchemy 2.0.30 and Python 3.12 — its asynchronous driver doesn't run on newer versions. - Every scenario is written the way that ORM's documentation writes it.
The benchmark is
benchmarks/bench.py in the
repository; its README lists
every scenario and how to run it on your own machine.